Module 2 

2.1
(Use this Reading Guide along with Text section 2.4 by reading the indicated pages from the text and then the following commentaries)
Definition of Function, Domain, and Range
Read pages138-141 &147
In terms of the “mapping” pictures used in the text (at the beginning of section 2.4) to explain the function concept, it may be helpful to think of the “domain” as corresponding to the “home base” or starting area of the arrows, and of course the “range” is where we shoot them to.
Another useful way of thinking of the function concept is to picture the function itself as a machine which accepts various possible values as input, and for each acceptable input produces a unique output.
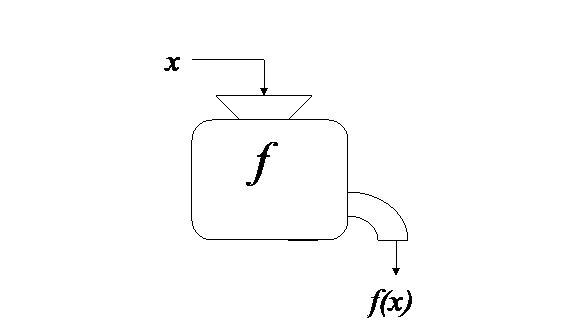
The function itself is the process or relationship itself rather than any of the variables. The commonly used phrase “y is a function of x” may be misleading in this regard. It would be more precise to say “there is a function which gives y-values in terms of x-values”.
It will save you a lot of grief later if
you make a point of distinguishing clearly in your mind between the “machine”
and its output. So is not the function itself, but rather the
value that is output by the function f
when it is given an input of x.
Unfortunately many people use the language
of functions in a way that can be confusing. When they speak of “the function ”, the inclusion of the argument x is misleading. They should really be
speaking just of “the function f ”,
and use
just for the result that is output by f
when given x as input. This
kind of confusing notation is common in applications.
Geometrical and physical relationships
provide many examples of functions. For example the area of a square of side
length x units is given in square
units by .
People often say “A is a function of x” and write
.
This is often clear enough, but remember
that the function giving area in terms of, say, the length of the diagonal
would be different and so we’d have to be careful not to use the same name for both
relationships. More examples of this kind are given on page 147 of the text and
both of the shorthand ways of expressing things are used in Example 8 on that
page.
Q1
Since we use letters for the names of
functions as well as for numbers, it is important when reading an equation or
formula, to think about what the symbols actually represent and not apply rules
we have learned for numbers to symbols that represent functions.
A common mistake is to apply the
“distributive law” to an expression like ,
but Example 1 on page 139 of the text shows that this is not valid. Can you
think of any example of a function
for which
is true? (See answer
#1)
Note also that any rule or procedure that produces a unique result for each input is an example of a function. Tables, physical measurements, and graphs can all be used to define functions without reference to formulas. And, speaking of formulas, it is quite ok to use more than one formula so long as only one result is allowed for each input.
For example is a perfectly good definition of a function
because what it means is that the function f
gives result +1 if its input is positive and result -1 if the input is negative
(and is not defined when the input is zero). So there is no input for which it
gives more than one result.
Q2
What are the domain and range of f in the above example?
and what about ? (see answer #2)
Basic Properties of Function Graphs
Now read pp142-146
Any set of points drawn in the plane is a graph. For a function, f, the graph of f is the set of points satisfying the equation ,
and since this gives only one possible y-value
for each x, it must pass the Vertical
Line Test (VLT). Conversely, any graph which passes the (VLT) can be used as
the definition of a function. (Just
define
to be the y
coordinate of the point where the graph meets the vertical line
.)
The graph of a function is better than a
table for showing us how the function behaves. For example we can see at a
glance from the text’s Figure 5 (on page 141) that the temperature is
increasing up to ,
stays constant for a while, and then falls rapidly.
(Our understanding that time is progressing as we move to the right on the graph, is due to the fact that the conventions of graphing follow the western tradition of reading from left to right. So a horizontal axis typically has its positive direction on the right.) Thus T being higher on the right for t in the interval (0,5) corresponds to the temperature increasing as time goes on.
In general, we say that a function is increasing in any interval where greater values of the input give greater values of the function, and decreasing where greater values of the input give lesser values for the output. When we draw axes in the usual way with the independent variable, x, increasing to the right and the dependent variable, y, increasing upwards, then a function is increasing where its graph goes up as we move to the right and decreasing where it goes down as we move to the right. Note though that this means that an increasing function goes down on the left, and a function that goes up on the left is decreasing.
So, for example, is increasing for
but decreasing for
and
is increasing for all x.
Q3
Can you sketch the graph of a function which
is increasing on
,
decreasing on
,
constant on
,
and increasing on
?
(see answer #3)
In the special case of a linear function, its graph is a straight line whose slope determines whether the function is increasing (slope>0), decreasing (slope<0), or constant (slope=0).
(and that slope can be determined either from the equation or from any two points on the graph). But for more general functions the slope of the line joining two points on the graph depends on which two points we pick. The line joining them is often called a secant line and the slope of the secant line is often referred to as the average slope or average rate of change of the function over the interval between its endpoints (and since the slope is a ratio of differences it is often also called a difference quotient).
For example, the average rate of change of between
and
is given by
,
and the text’s Example5 on page 145 is giving the average rate of change of
between x
and
.
Q4
|
Q4 |
Compute and simplify the difference
quotient for
,
and then use it to find the average rate of
change of between
and
a) , b)
, c)
(see answer #4)
Further Practice
Check your understanding, and practice for speed, by working through some of the Exercises on pages 150-155 of the text (at the end of Section 2.4).
Do enough of the odd numbered questions of each type to convince yourself that you can get the right answers. (Note that, as usual, the answers are in the back of the text and complete worked solutions are in the student study guide - but try to avoid looking at answers or solutions until you have made your own best effort.)
As a bare minimum you should do ##1,3,5,15,23,33,45,55, 63, 65 and 69 and when done, compare your solutions with those in the student solutions guide.